Site performance tool

DebugBear
What is DebugBear?
DebugBear monitors website performance and Core Web Vitals using both synthetic tests and real user monitoring, with regression alerting and detailed debugging data.
Best for: Engineering teams that need to catch performance regressions and diagnose their cause.
DebugBear pros and cons
Strengths
- Combines synthetic testing with real user monitoring rather than one or the other
- Alerts on regressions and attributes them to specific changes
- Detailed debugging data including request-level analysis
- Strong, frequently cited technical documentation
Limitations
- Priced for teams rather than individual site owners
- Depth assumes engineering knowledge to act on
- Performance only, with no wider SEO features
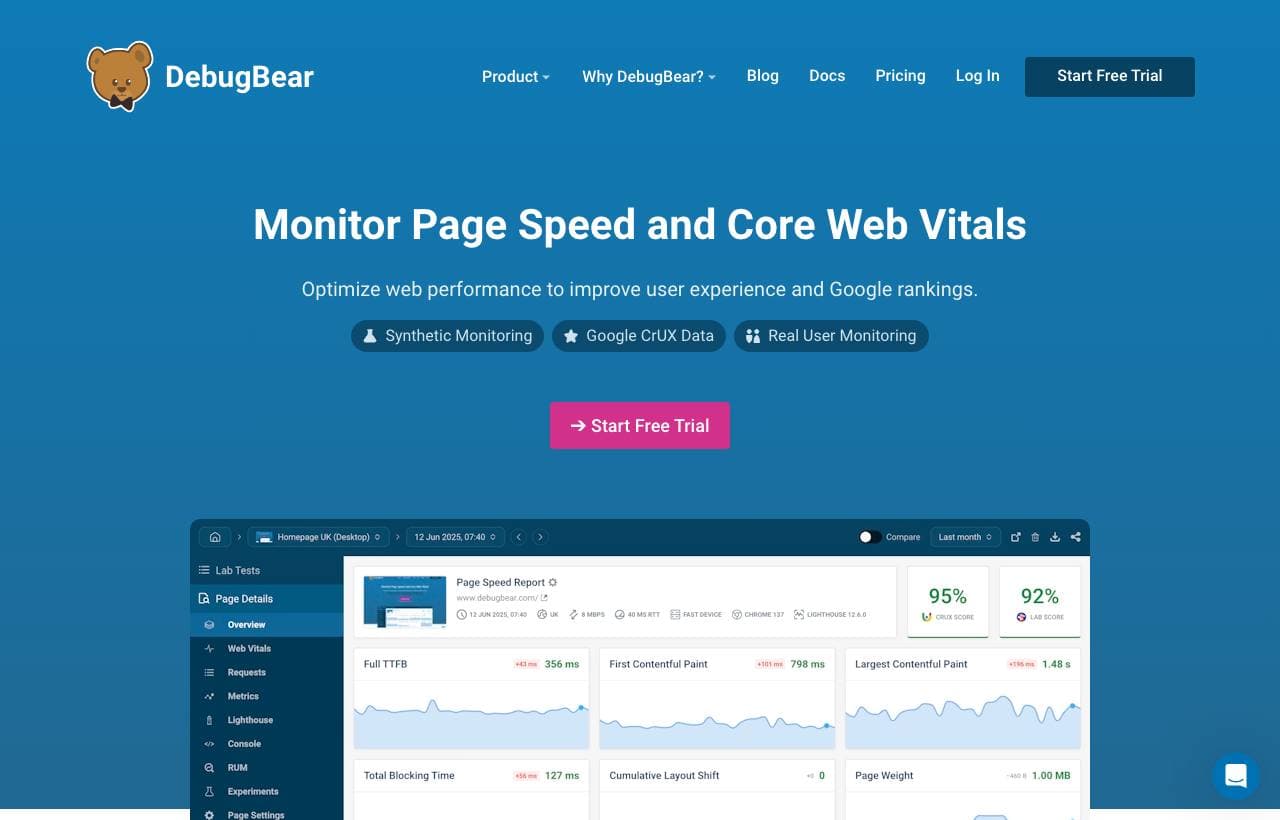 Homepage
Screenshots of debugbear.com, captured by Honeyb.
Does AI recommend DebugBear?
No published measurement yet. Honeyb tracks how often Claude and Perplexity name tools for real buyer questions, and none of the questions this directory publishes covers DebugBear. How the measurement works.
FAQ
- What is DebugBear?
- DebugBear monitors website performance and Core Web Vitals using both synthetic tests and real user monitoring, with regression alerting and detailed debugging data. Its website is debugbear.com.
- Who is DebugBear best for?
- Engineering teams that need to catch performance regressions and diagnose their cause.
- What are the main strengths of DebugBear?
- Combines synthetic testing with real user monitoring rather than one or the other. Alerts on regressions and attributes them to specific changes. Detailed debugging data including request-level analysis. Strong, frequently cited technical documentation.
- What are the limitations of DebugBear?
- Priced for teams rather than individual site owners. Depth assumes engineering knowledge to act on. Performance only, with no wider SEO features.
- Do AI models recommend DebugBear?
- Honeyb measures which tools Claude and Perplexity name for real buyer questions. None of the questions this directory publishes covers DebugBear, so there is no figure for it yet.
- How is DebugBear's AI visibility measured?
- Honeyb asks Claude and Perplexity real buyer questions and records which tools each names. This page aggregates those measurements for this tool. See the methodology page for the full method.
Other site performance tools

Google Mobile Friendly Test
Google's Mobile-Friendly Test checked whether a page met Google's mobile usability criteria. Google retired the standalone tool, and mobile usability is now assessed through Search Console and Lighthouse.
Google PageSpeed Insights
PageSpeed Insights is Google's free tool reporting Core Web Vitals and performance for a page, combining lab data from Lighthouse with real-user field data from the Chrome UX Report.
Named in 1 of 19 questions

GTmetrix
GTmetrix tests and monitors page performance using Lighthouse, generating scores and prioritised recommendations, with scheduled monitoring and multiple test locations.
Named in 1 of 19 questions

Pingdom
Pingdom Website Speed Test is a free tool analysing page load performance from several global locations, with a paid uptime and real-user monitoring product alongside.
Named in 1 of 19 questions
WebPageTest
WebPageTest is an open-source web performance testing tool offering detailed waterfall analysis, filmstrip views and testing from many real locations, browsers and connection profiles.
Named in 1 of 19 questions
DebugBear resources

Free to start
Get recommended by AI search models.
Run a free AI search visibility check, then let the Honeyb agent do the work that gets you into the answers.
 ChatGPT
 Claude
 Gemini